Please note that this does NOT apply to Raspberry Pi and Arduino devices connected as ‘Bring Your Own Thing’ (MQTT) devices. For those, or any MQTT or LoRa connected device, you want this sister post.
I’ve found that the “Download Chart Data” button doesn’t always satisfy everyone’s needs to pull data which has been logged to Cayenne out of the system. The purpose of this post is to show you how you can extract the raw sensor data for Raspberry Pi and Arduino devices from our system.
The process is a bit complex, but should allow you to work around any bugs or limitations in our data download feature until such time as we improve it. Once you’ve done it a few times it becomes fairly straightforward.
To extract this historical widget data:
-
Install the Postman Chrome App: Postman - Chrome Web Store
-
You’ll need to get something we call an ‘access token’. To get this, log into the Cayenne web dashboard on your account in Chrome, and open the console with View > Developer > JavaScript Console. In the console, paste:
localStorage.getItem("session"). This will return something like this:{“id":“728005”,“email”:"testtest@test.com”,“first_name”:“Test”,“last_name”:“Test”,“access_token”:“eyJhbGciOiJIUzI1NiIsInR5cCI6IkpXVCJ9.eyJlbWFpbCI6InJvYm55MjAxN0B5b3BtYWlsLmNvbSIsImZpcnN0X25hbWUiOiJSb2IiLCJsYXN0X25hbWUiOiJUZXN0Iiwic2NvcGUiOlsic2VsZiJdLCJ1c2VyX2lkIjoiNzI4MDA1IiwiaWF0IjoxNTAzMDg3NDE5LCJleHAiOjE1MDQzODM0MTksImF1ZCI6Im15ZGV2aWNlcy5jYXllbm5lLnByb2QiLCJpc3MiOiJteWRldmljZXMuYXNnYXJkLnByb2QiLCJqdGkiOiJmZjI5OThjNS0yNGU4LTRiYWMtODIwZC0zODAyNzgzMjBjODkifQ.h_KQmJR8wcCghHMqgcvcYFgfv8PqmWUJ1VbaYlR9fXA”,“refresh_token”:“cf265d2aeee235a93b876d3773fce106baa89fc8”,“client_id”:“0d31d860-3591-11e7-85a7-c34806d4e04d”,“client_secret”:“b1ba96b44f102eedfd47aafdf92474bd2782b563”}
The access token is the part that I’ve bolded, and will be different for your account.
-
Next, you’ll need two more items, a ‘machine id’ which identifies the parent device on your Cayenne account, and a ‘sensor id’ that identifies the widget you want to pull historical data for. You can get these both at once. Open the Settings dialog for the widget whose data you’re pulling on the web dashboard, and make note of what’s in your browser address bar. Here is an example from a BMP180 Temperature Widget on a Raspberry Pi on my account:
https://cayenne.mydevices.com/cayenne/dashboard/raspberrypi/039a82c0-842a-11e7-a9f6-4b991f8cbdfd/settings/7fb622147dd6766ffe51680c3145e7643fa8d516In this case,
039a82c0-842a-11e7-a9f6-4b991f8cbdfdis my machine ID, and7fb622147dd6766ffe51680c3145e7643fa8d516is my sensor ID. -
Next you need to get the UNIX timestamp for the start and end times of the date range you want to pull. This website is pretty useful for that.
I’m writing this at Fri, 18 Aug 2017 21:23:25 GMT, so I’ll make that my end time. Using the site, it converts to the UNIX timestamp 1503091405. Let’s say I want to pull the last hour and 10 minutes of sensor data, so using Fri, 18 Aug 2017 20:13:25 GMT as my start time, that converts to 1503087205.
-
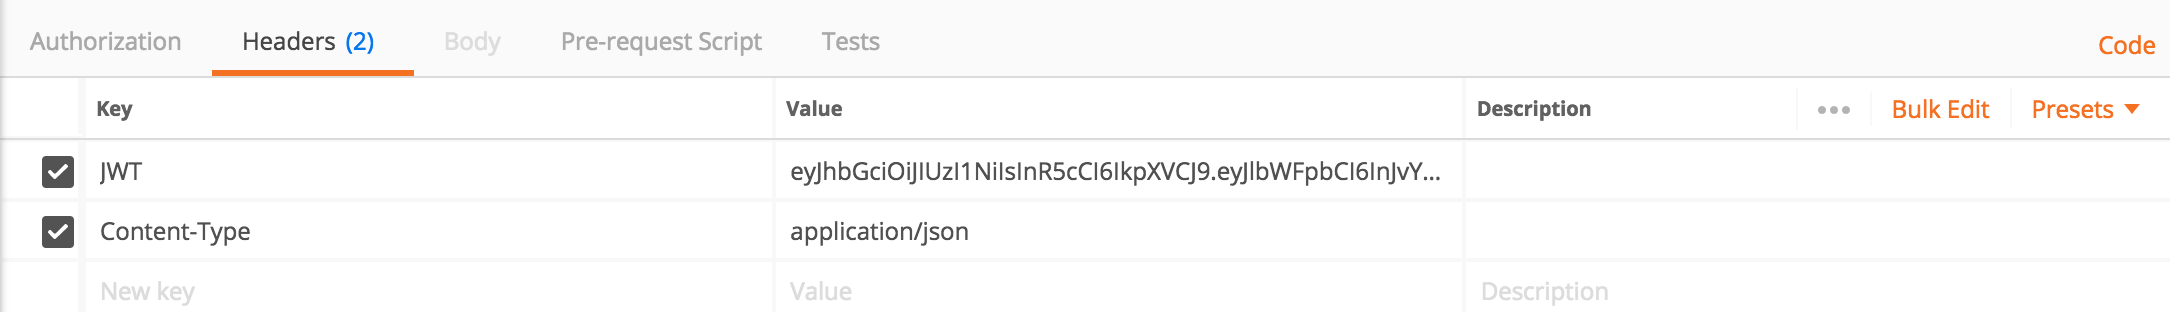
Next, launch Postman that you downloaded in step #1. Go first to the ‘Headers’ tab. You’ll need to add two keys here:
- One key named
JWTwith a value of your access token from step 2 - The second key named
Content-Typewith a value ofapplication/json
-
In the large “GET” field, you need a URL of this format: https://cayenne.mydevices.com/cayenne/api/history/get?scale=minute&machine_id=YOURMACHINEID&type=YOURSENSORID&start=STARTTIME&end=ENDTIME
the
scalevalue can be set to minute,hour,day,week,month,year, I’ve used ‘minute’ here for the most granular data. So using all of my examples in this post, my GET URL looks like:https://cayenne.mydevices.com/cayenne/api/history/get?scale=minute&machine_id=039a82c0-842a-11e7-a9f6-4b991f8cbdfd&type=7fb622147dd6766ffe51680c3145e7643fa8d516&start=1503087205&end=1503091405 -
The moment of truth: press the big blue ‘Send’ button in Postman. If everything was set correctly, you’ll be rewarded with a JSON readout of each of the data points you requested (in my case about 70 of them, one for every minute in the hour and 10 minute window I chose). To show the general format, mine looks like this: [ { "InsertedTimestamp": 1503087509, "MachineId": "039a82 - Pastebin.com if you’re curious about the weather in my office

![]() That’s it. Let me know if you get stuck following that or have questions. It’s finicky but once you get the hang of it, just rinse and repeat for each sensor.
That’s it. Let me know if you get stuck following that or have questions. It’s finicky but once you get the hang of it, just rinse and repeat for each sensor.