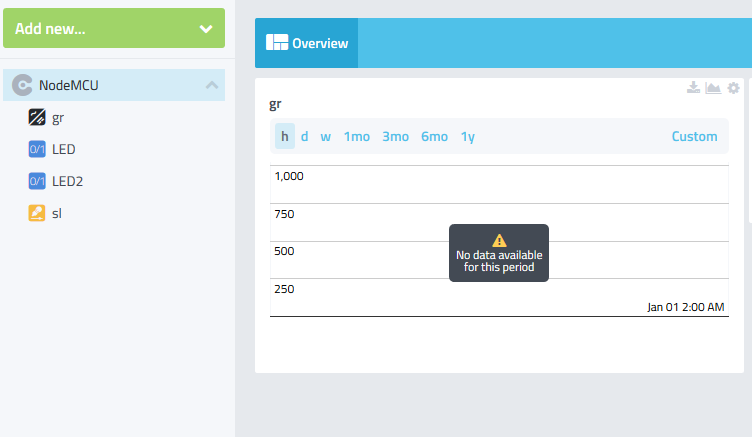
Hi, I am working on a project where I read an LDR with the NODEMCU ESP8266 board and I want to display the value on a Line Chart, I followed this tutorial Test Platform IoT Cayenne & ESP8266 NodeMCU in 5 minutes: PDAControl - YouTube , but I cannot figure out why my chart doesn’t display anything… also I do not have the “live” option to select… so, by default it is set to “h” and I have the message " No data available for this period ".th
if I want to display only the value, it works
, also the control of the LED works, only the chart doesn’t work,.did somebody faced also this problem ? could you help me ?
Are you using MQTT API? if so I found this on release notes:
Known Issues
Custom ranges for data history graphs are currently not working for MQTT and LoRa connected devices.
Server side slowness with MQTT and LoRa triggers/notifications.
It’s been a few months, is there any further word on this?
I too have this same problem. I have a Sparkfun Thing Dev board with three temperature sensors on it. The first one (channel 0) gets data and does have a chart data, but the other two (channel 1 and 2) don’t show values in the charts but the gauges do.
Thanks, @adam - adding a delay there looks like it did the job. I’m going to let my Thing run a bit to ensure the data is collected but looking fine so far.
I’m also sending via MQTT from a custom device and I’m getting the same issues.
I’m sending a QoS1 publish, waiting for the acknowledge packet (which takes about 300mS), then I wait about 200mS before sending the next value. That seems quite slow to me. Is that still too fast for the line graphs to work?
For what it’s worth I ended up going with a 1000mS delay between packets, but then I only take three readings every 5 minutes so it’s not a big deal in my case.
I’ll tag @rsiegel but I’d say it probably is too fast. From what I’ve seen in the past the default rate to send values back to Cayenne was every 5-10 seconds. Cayenne is meant to be more of a general display of what’s going on rather than a this is the value at this very second kind of thing. To put it another way, hundreds of thousands to millions of devices sending packets faster than every 1 second uses a ton of bandwidth and processing power.
I would aim for 10+ seconds for sending data from any MQTT device. I don’t have any reason to say a feature like the line chart wouldn’t work with more frequent samples, just that our Engineering Manager said he would throttle people if they were sending data more than once a second.
That being said, about the line chart:
It is expected that the “Live” tab is missing for MQTT and LoRa connected devices, nothing has gone wrong here, this is simply a design choice and partially reflective of the fact that we’re not expecting these devices to update so frequently. The Live tab should still appear for Pi and Arduino devices connected through their own connectivity options in the Cayenne UI. It may re-appear for MQTT/LoRa devices in the future but I’m not aware of any immediate plans to do so.
I expect that the “No Data Available for this period” message should clear as soon as there is sufficient data in each of the tab views. For the hour view this should be no more than 60 minutes, and for the day view no more than 24 hours, and so on. If you’re still seeing a blank line chart and your device has been connected sending data for longer than those times, we might be onto some sort of a bug.
If you find one or more of your MQTT widgets in that state, it would help me to troubleshoot if you could try the steps in this post to extract the data that we have stored for that widget and shared with me at support@mydevices.com so I can investigate. Or PM me with your account credentials and a mention of the problem widget(s) and I’d be happy to extract/investigate myself.
Maybe my earlier post was misleading. I’m not sending data continuously at that rate. The fastest update period we would ever use would be 1 minute and probably every 10 minutes would be typical. However for each update we may send 3 or 4 different parameters and the timing figures I gave earlier represent the intervals between these parameters only.
It also seems strange to me that the instantaneous values one gauges etc, all update correctly. It’s just the line graphs which always report no data, regardless of how long I leave it.
Yeah, my impression is that the update rate for the device is wholly unrelated to any issues with populating the line chart. I just wanted to answer the question about expected publish rates.
Can you let me know what type (units, values) of data you’re sending to the widget(s) that are having trouble populating like this. I suspect it’s probably an issue on our back end and nothing you can resolve on your own, so I’d like to set up a reproduction case and investigate with our engineers.
Thanks for the email @mulder.roy, I think I’m much closer to why this is happening now, though I don’t have a fix just yet.
In investigating your account (as well as discovering this same behavior on some devices on one of my test accounts), I can see that there are 404 errors returning each time these data history graph tabs are clicked on the problem widgets. Here is a screenshot from one of my test accounts:
This at least explains pretty well that this is ultimately a data retrieval issue on our end and not some problem with the data send rate. I’ll investigate with our IT/Engineering why these 404’s might be occurring so we can ultimately put a stop to them. If anyone else is seeing empty line charts, I’d be curious if you’re seeing 404’s like this in the browser console (View > Developer > Javascript Console on Chrome)