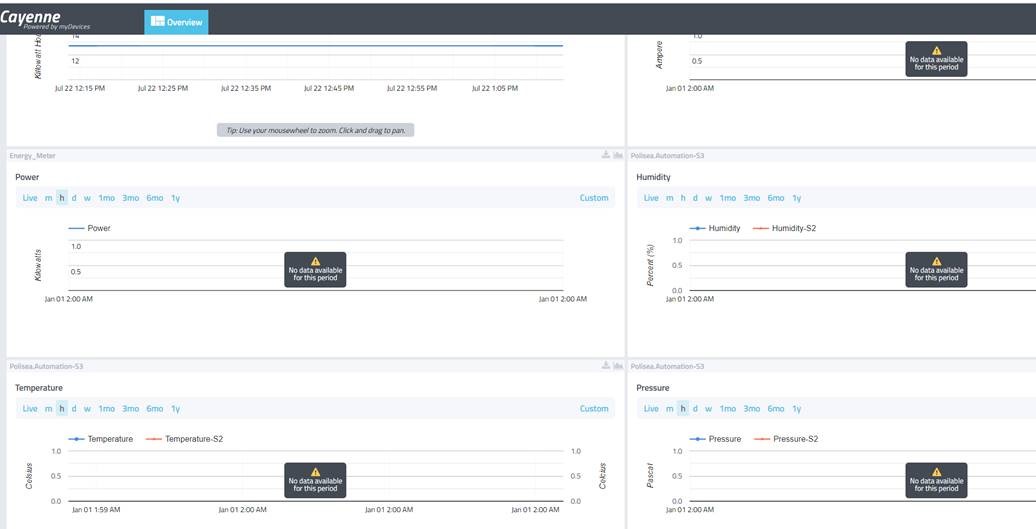
I am sending data to myDevices Cayenne dashboard from Bosch sensor and energy meter. My energy meter data show properly in the graph chart when I change the time period like Live/minute/hour. But Bosch sensor data is working when I set it on Live but when I change it like set it minute/hour/day it does not work. Can you tell me why it does not work? I also attach some screenshot of my dashboard.

can you remove the widgets which are not showing history data on graph and let it re-add on next publish. (this will delete all previous data for that widget)
1 Like
I tried all way but it does not work. I also create a another dashboard.
And i also try to send two sensors data in one wigged but its showing one value. But i don’t know why.
One more thing when i try to show my dashboard in my phone it change the time period…is it not mobile friendly or what?
this is what is the issue, you cannot use one widget channel to send two data.
The web dashboard is does not work on mobile.
Thank you for your replay. Now it is easy for me to explain why it does not work on mobile.
But do you know why it does not work when i change the time period which data i get from Bosch sensor.
i did not understand.
[quote=“ariful.islam, post:1, topic:15026”]
Bosch sensor data is working when I set it on Live but when I change it like set it minute/hour/day it does not work. Can you tell me why it does not work? I also attach some screenshot of my dashboard.
[/quote
here.