Thank you for taking the time to submit your bug/issue! Please use the points below as a guide when submitting.
- Device & model you are using (Ex: Pi 2 Model B or Arduino Uno with W5100 ethernet shield)
NodeMCUv3 (ESP8266)
- What dashboard are you using? (Web, iOS, Android)
Web and iOS
- Please describe the bug / issue as detailed as possible. Attaching the code and any relevant screenshots would be very helpful!
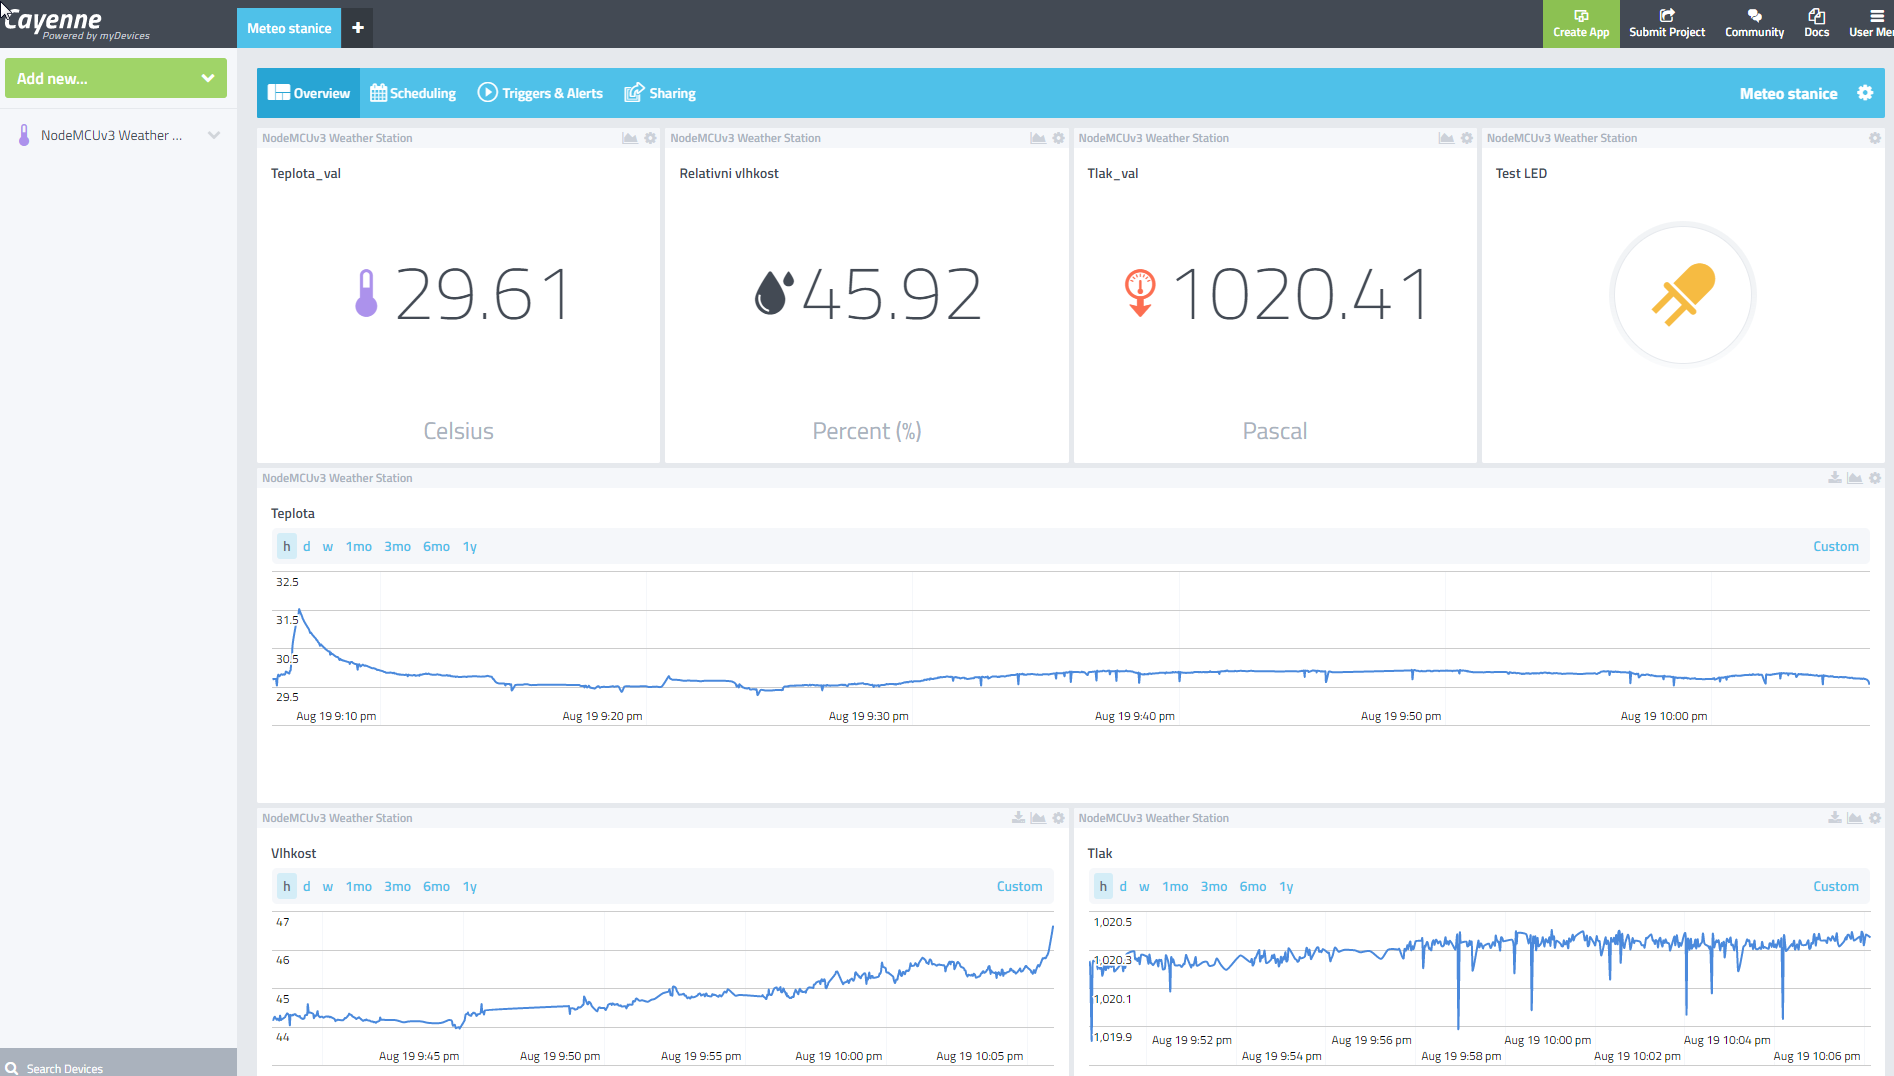
My meteo station looks fine on web dashboard (screenshot below) but is pretty broken on iOS.
This is the web dashboard in Opera.
This is the dashboard in iOS. True, its not the project window but the device one, but they are pretty much identical anyway and both suffer same issues.

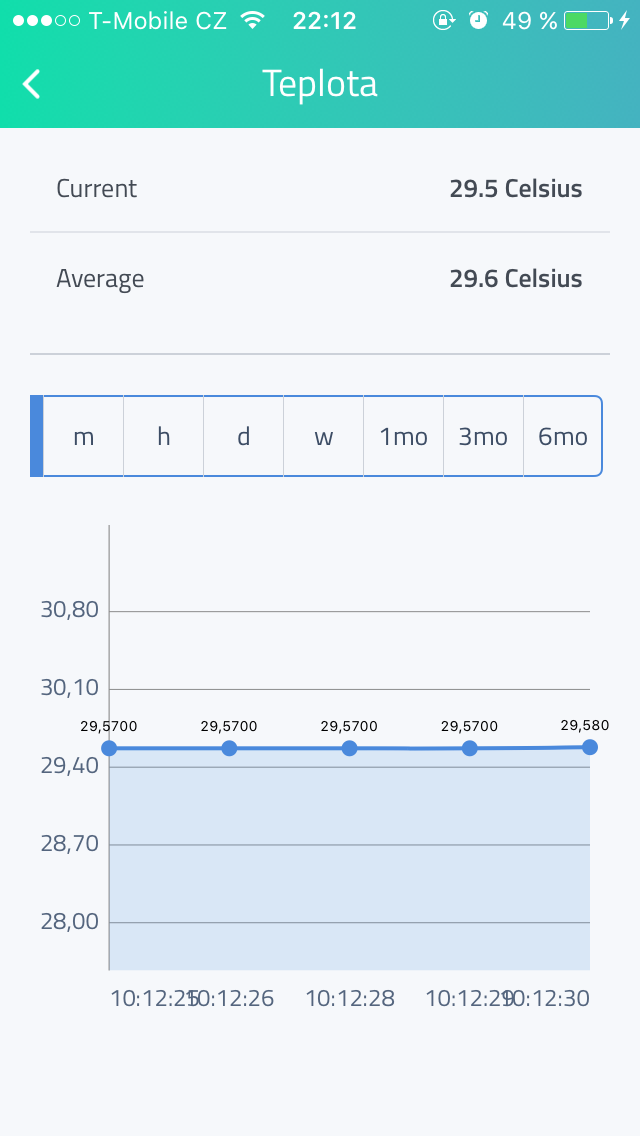
There are several things wrong with it:
- The worst thing is that the temperature value gadget doesn’t work and shows only 0, while on web it does work correctly and refreshes every second or so without issues.
- Then you have the line graphs: two of them don’t even make a line and just show a single point of data, as you can see in the screenshot above.
- Then you have the inability to permanently change the time scale of the chart - if I tap on it I can set it to hours instead of whatever the weird unit that is smaller than minutes is (I think the time scale setting is broken too, just look at it), but when I go back it resets back to the default shortest timescale again.
- Whats also weird is that I can zoom in the charts, but I can’t zoom OUT.
- And finally you have the really weird placement of the gadgets - I can fix it, sure, but then it breaks the Web dashboard.
To my mind it seems like its completely broken, but I tried reinstalling it and it didn’t help at all. What gives?
Also a side question: how long is the data stored for? Can I look at the temperature graph in 5 years and look at 5 year long line chart?
EDIT: Also the web dashboard constantly says my device is Offline even though it updates data no problem and the device is connected. No idea whats happening there either.
Thanks!
Code is below. As you can see I tried to use SimpleTimer library but it ended up not working so I run it without it.
#include <CayenneMQTTESP8266.h>
#include <Wire.h>                   // nutné pro I2C komunikaci s meteo senzorem
#include <BME280_t.h>               // nutné pro samotný meteo senzor
#include <SimpleTimer.h>

#define CAYENNE_DEBUG
#define CAYENNE_PRINT Serial

#define ASCII_ESC 27
#define MYALTITUDE  300   // nadmořská výška definována jelikož s ní pracuje výpočet tlaku vzduchu
char bufout[10];
BME280<> BMESensor;

SimpleTimer timer;

float temp,hum,pressure;

char ssid[] = "";
char password[] = "";

char username[] = "";
char mqtt_password[] = "";
char client_id[] = "";

void setup() {
    //timer.setInterval(5000L, senzor);
    Cayenne.begin(username, mqtt_password, client_id, ssid, password);
    pinMode(16, OUTPUT);
    digitalWrite(16, LOW);
    Wire.begin(0,2);            // inicializace I2C komunikace se senzorem
    BMESensor.begin();
}

void loop() {
    Cayenne.loop();
    senzor();
}

CAYENNE_IN(0)
{
    digitalWrite(16,!getValue.asInt());
}

void senzor()
{
    BMESensor.refresh();    // provést odečet hodnot ze senzoru
    temp = BMESensor.temperature;
    hum = BMESensor.humidity;
    pressure = BMESensor.seaLevelForAltitude(MYALTITUDE)/100.0F;
    Cayenne.virtualWrite(1,temp,"temp","c");
    Cayenne.virtualWrite(2,hum,"rel_hum","p");
    Cayenne.virtualWrite(3,pressure,"bp","pa");
}